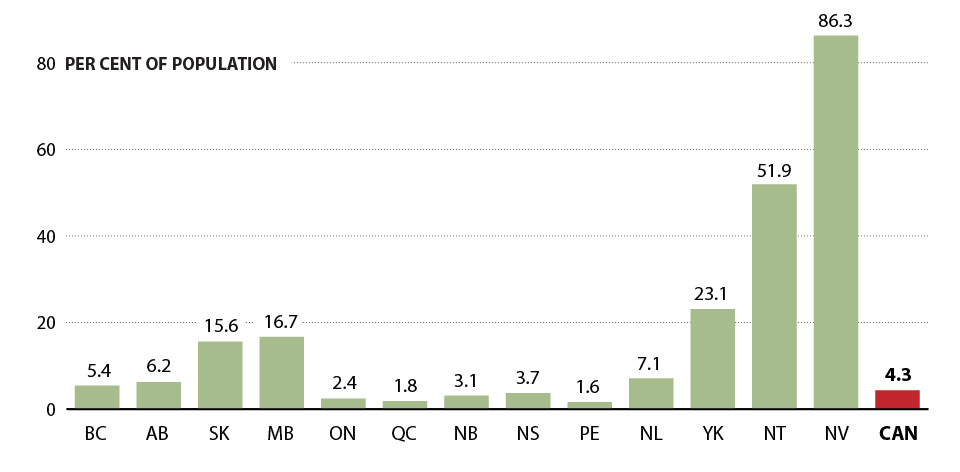
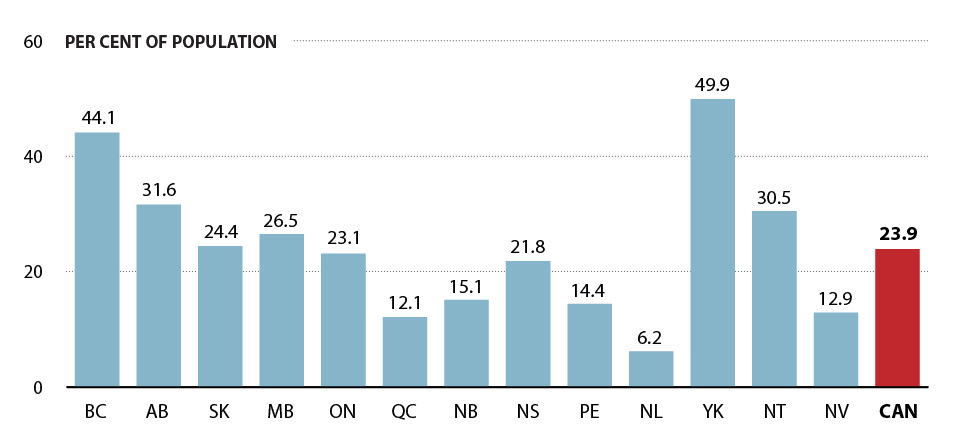
ABORIGINAL POPULATION
A look at the percentage of the population reporting an aboriginal identity in 2011
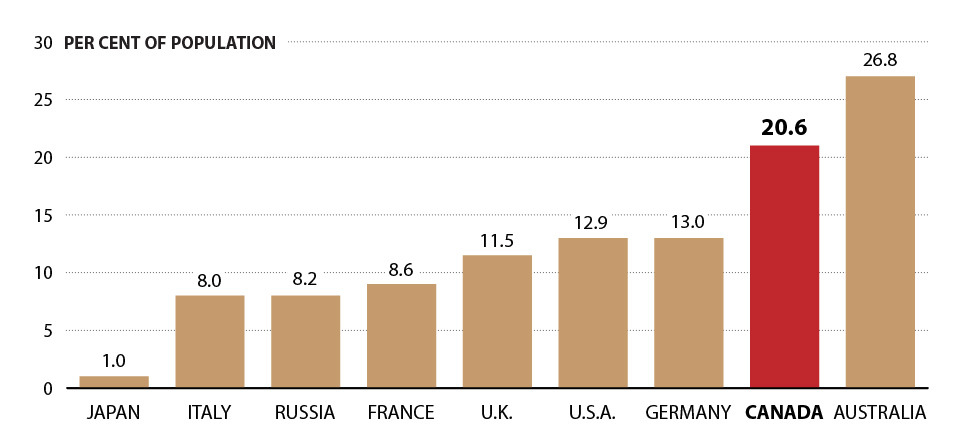
FOREIGN BORN POPULATION
Foreign born as proportion of the population, G8 countries and Australia
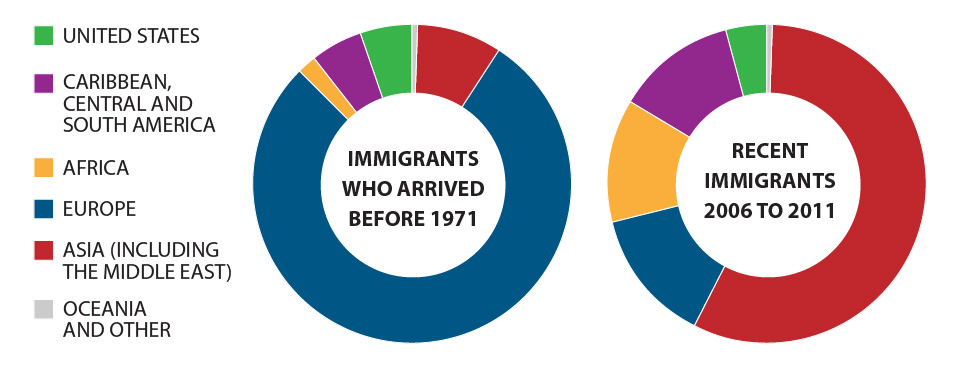
WHERE IMMIGRANTS COME FROM
A look at the place of birth of immigrants by period of immigration
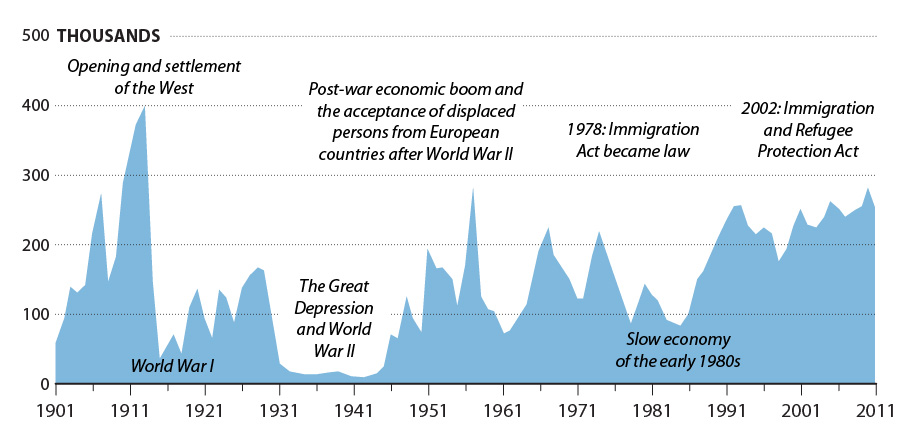
IMMIGRATION TO CANADA
The annual flow of immigrants has remained between 200,000 and 300,000 during the last decade
NONE OF THE ABOVE
A look at the percentage of the population with no religious affiliation in 2011
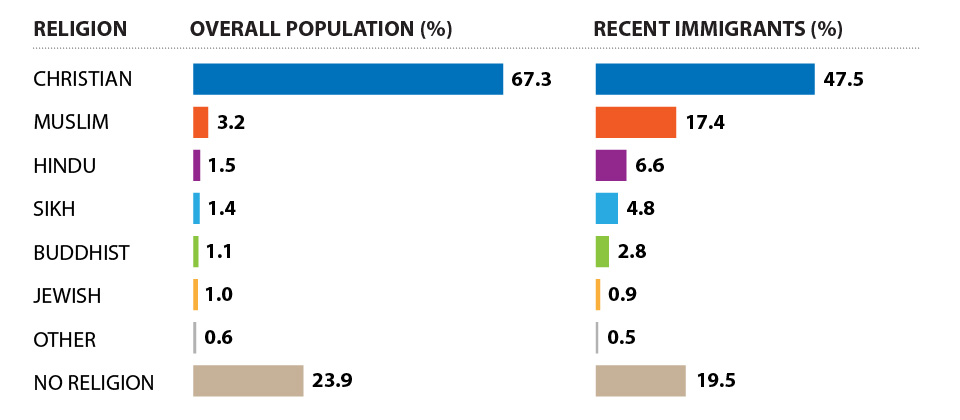
RELIGIOUS AFFILIATIONS
A look at the religious affiliations of recent immigrants (2006-2011) compared to the overall population
TOP ETHNIC ORIGINS
In 2011, 13 ethnic origins had surpassed the 1-million mark in population
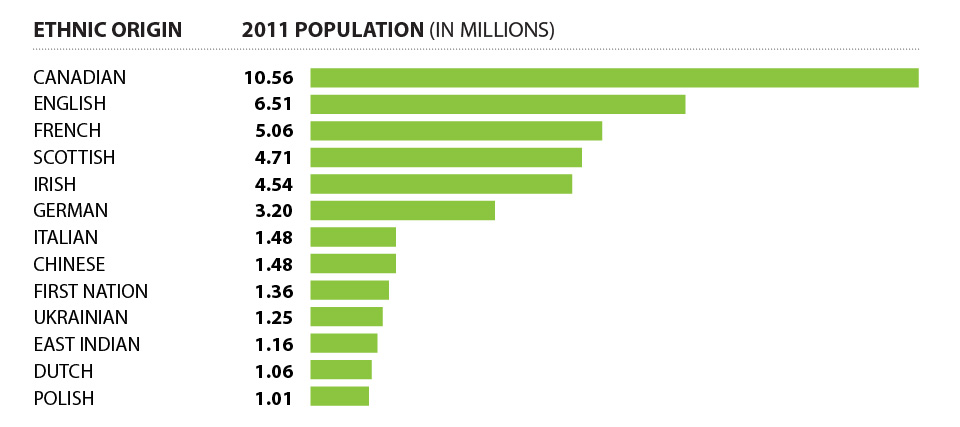
The sum of all total responses for all ethnic origins is greater than the total population estimate due to the reporting of multiple origins.
VISIBLE MINORITY POPULATION
A look at the growing percentage of visible minorities

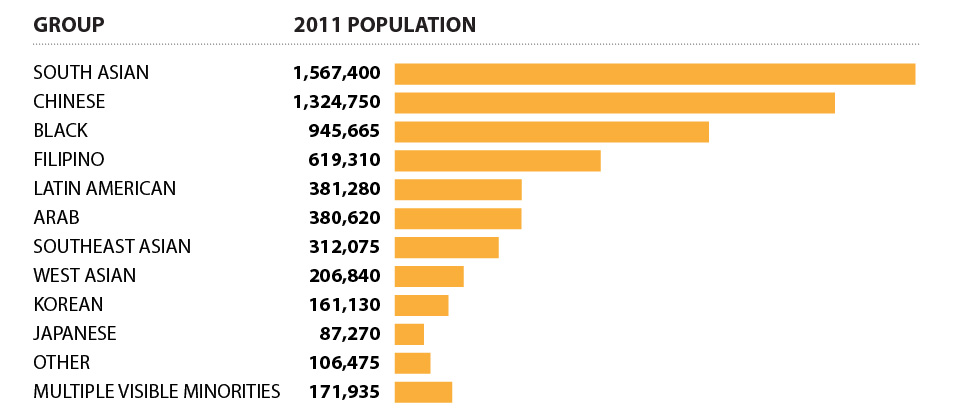
VISIBLE MINORITY GROUPS
A look at the population of visible minority groups in 2011